26 Ekim 2016 Çarşamba

Voxxed Days Belgrade 2016

Finally I have presented (almost) all my works. It was a great pleasure to be part of Voxxed Days Belgrade 2016. Search #vdb16 in twitter and instagram to see what happened there.
We went there 4 colleagues from Peak Games
It was started with arrival of our flight. Dimitri was waiting for us, he is one of the actual organisers. He is so nice and funny guy, we had great times with him during the event. And actually he has been to Turkiye multiple times, and seen some of uncommon places for a tourist like Diyarbakir, Nemrut Mountain etc...


We had one day off before the event to have some sightseeing and to taste some traditional Serbian cuisine. I think one or two days are quite enough to know the Belgrade. Of course it is based on our performance on the first day. Thanks to Selim, we have done 30K steps in total. And went almost every location by walk. Then we learnt that there is 5 days bus ticket (for 1040 Dinars around 10 Euros), use that ticket and public busses for the rest of the days.

By the way, in general foods and drinks (with alcohol or not) is very very cheap, and the taste is quite similar to Turkish style. I strongly suggest to make a trip to Belgrade, especially if you consider that we (Turkish citizens) don't need visa for Serbia.


Let's come to the event. The opening with the music of Tesla Coil and a very big Gong was fantastic. And also keynote was very successful by Scott. Organisation was flawless. Overall talks were fine I guess, and sponsors prepared some great games, presents and stands. So overall it was a fantastic event. I have tried to attend as much talks as I can in the first day. For the first night, we went to Historical Museum of Serbia as speakers. Which was also very inspiring, I strongly suggest for the ones who visits Belgrade.

Second day my mind was full of my talk, so I have spend most of the time in the speakers room to get prepared on my talk. I could attend only some of the talks, but of course I didn't miss any of these delicious food :)  Second night we went to Nikola Tesla Museum as speakers. It was nice, but not like the Historical Museum. If you have one choice between these two museums I would suggest the former one.


After museum, I spent all night to get prepared for my talk. So finally the time had came and I did it. Here it is my talk, I didn't watch yet but I think I am happy with the result. It could have been better of course. But I think, I am getting better with every new presentation/talk :)


So as you might know, the talk was about Unity in general, specifically about these topics. You can find all the subjects and more here inside of this blog:
And this is my presentation stack, please take a look and leave your questions/comments.


Finally, I admit that it was not a big deal, but still it was not that easy for me. Especially from the language point of view, it is quite challenging to have a talk in a non-native language. So as a result I am happy about what I have done. I want to thank to my colleagues at Peak Games and also to my wife and my little ones Sarp and Atlas for their supports.

Please feel free to contact me about anything you wonder. Hope to be around with this blog couple of times in a month. Let's see...

23 Eylül 2016 Cuma

Unity Services

This is the last post about Unity3D, if you wonder what I have said before, please take a look:

5. Debugging in Unity3D
6. Performance Optimization in Unity3D
7. Continuous Integration and Delivery with Unity3D


With this last post I planning to explain Unity Services and Tools. Unity provides a range of services to help developers make games and engage, retain and monetize audiences. Unity Ads, Unity Analytics, Unity Cloud Build and Unity Multiplayer are fully integrated with the Unity Editor to make creating and managing games as smooth, simple and rewarding an experience as possible.


Unity Ads is Unity's video ads tool. It is designed to become a natural part of the game that actually enhances the players’ experience. We are already using Unity Ads to monetize some of our native games with rewarded video ads. But we didn't experience any Unity game yet. It is not that difficult to integrate on native platforms, I guess it will be much more easier on Unity games here it is the documentation.

Whether you offer your gamers a chance to earn more currency, extra life, or double their score in exchange for watching a short video, the power is in their hands. Your players can choose to watch the ad at the right place and time in their game experience - putting more money in your pocket over the gamer’s lifetime with the highest ARPU of any global rewarded video ad network.


Unity Analytics gives you an easy access to important information that helps you improve your in-game economy and the player experience. It has a dashboard to visualize your game data. In this data you will have high-level overview of how your game is being used. Players' progress (and where they get stuck). Address different audiences by creating player groups and segments based on unique game scenarios and behavioral patterns. We are not using Unity Analytics because we have our own custom analytics solution.

Another thing is, you can enable in-app purchases across multiple stores (iOS, Mac, Google Play, Windows and Amazon App Stores) with single API called Unity IAP. And it enables you to monitor and act on trends in your revenue and purchase data across multiple platforms. Learn how to set up Unity IAP for multiple stores. We are not using Unity IAP also. Because we have our existing custom native solutions optimized and working specific to our needs. We just created native plugin for these solutions and started to use in our Unity games.

One last thing is Unity Heatmaps. It provides a visualization of spatial events that occur in your game. Where do players clicks? Where do they scores? Which roads are most travelled in your game? By collecting the data from hundreds or even thousands of plays, you begin to assemble a large-scale picture of how your players experience your game. The patterns that emerge can help you tune your game. So you can improve your game economy, reduce the gameplay difficulty curve and increase the level of player enjoyment. This is something that we are planning to use sometime in the future, but right now we didn't try it.


Unity Cloud Build helps you to automate your pipeline of compile, build, deploy and test. Simultaneously build for multiple platforms and app stores. And also distribute and share your builds that your team can easily download and install from anywhere. So it is yet another continuous integration and delivery tool specific to unity games by Unity. Since we have our own CI solution, we are not using this one either. Actually there is also other issues like being queued among all Unity Cloud Build customers.


Unity Collaborate is there for small teams to save, share, and sync their Unity project. It’s cloud hosted and easy to use so the entire team can contribute to the Project, regardless of location or role. Your project is cloud hosted so you’re always up to date with your team, no matter where you are. You can invite collaborators right in editor and start working together. It can be used by the entire team artists, QA, everyone (15 members max). It is in beta right now, and requires 5.4+ version of Unity3D.  It is something we are planning to use (after beta) because right now it is impossible to work together on the same scene or prefab concurrently. I hope it will resolve these issues.


Everyplay is a SDK for recording game play of user. Recording is done in the background with virtually no impact on performance for users. According to Unity, players love replays. A user that watches game video typically plays more often and plays for longer than the average user. And it helps to market your game as your players share your game's replays, their friends will try it out too. We are not using it, and I am not sure if we even think it in the future. Once we tried built-in iOS Game Recording mechanism but it didn't work for our game genre.


The purpose of Unity Multiplayer is to create real time, networked games for Unity. It’s fast to implement and highly customizable. Unity-provided servers ensure that your players can find and play with each other. It can be used from turn based games to real time fast action games. Unity Matchmaker Servers makes it easy to connect your players. Unity Relay Servers brokers network traffic to ensure quality sessions between your players no matter where they are. See more on this documentation. We are not using this service also, because we have our own dedicated, robust, highly scalable and performant servers (some of our games have more than 100K concurrent users). And they are not generalized servers,  they have been developed and being maintained specific to our games. We are not planning to use this in our board games, may be we can think some experimental games in the future.


Unity Performance Reporting automatically collects application errors, across devices and platforms, so you can find and address issues in real time. It consolidates errors across platforms, devices, and builds. Automatically collects and views errors as they are generated by app users. And best part is it requires no sdk. We are not using this one either. We are using Fabric/Crashlytics for tracking our crash reports. Actually we are very happy with it on native games. But on Unity games it is not as good as the others. We didn't discuss or investigate yet, but if Unity's solution is better than Fabric, we can think to move this one.


Unity Asset Store is home to a growing library of free and commercial assets created both by Unity Technologies and also members of the community. A wide variety of assets is available, covering everything from textures, models and animations to whole project examples, tutorials and Editor extensions. The assets are accessed from a simple interface built into the Unity Editor and are downloaded and imported directly into your project. Unity users can become publishers on Asset Store, and sell content they have created. To find out more, see Asset Store Publishing

We are definitely using Asset Store actively (as a customer, not as a publisher yet). We have downloaded both free and paid assets. We are using some of them directly in our games and some of them to just investigate or to get inspired.

Here it is some of the assets that we are using directly (or in-directly):
  • DOTween is a fast, efficient, fully type-safe object-oriented animation engine, optimized for C#.
  • UniWebView is an easy solution for integrating WebView to your mobile games. You can set up a web view and embed web content in your game.
  • Log Viewer helps you to check your editor console logs inside the game itself even on mobile.
  • JSON .NET brings the power of Json and Bson serialization to Unity with support for 4.7.2 and up and is compatible with both .NET and IL2CPP backends.
  • TextMesh Pro is the ultimate text solution for Unity. It's the perfect replacement for Unity's New UI Text & Text Mesh.
  • Best HTTP is a plugin that supports request customization for REST, WebSocket, Socket.IO, SignalR, Server-Sent Events (and much more) out of the box. 
  • Console Enhanced is a vastly improved editor console for Unity.
  • Realistic Effects Pack The package includes effects with particle systems, uv-animated textures and distortion for mobile. Dimensions are approximate to reality.
  • Enhanced Scroller virtualizes your data, showing only the elements it needs to. Take thousands of rows and display them in a handful of UI elements, speeding up processing and saving memory. 
  • Stats Monitor is a customizable FPS counter and performance measuring tool.

Unity Labs is Unity's experimental projects, research, and explorations into the future of game design, VR, AR and development. Some of the current services started inside the Unity Labs like Heatmaps. Most probably you will not find anything that you can use directly in your game. But it can inspire you or helps you create new ideas. And articles gives you some deep knowledge of Unity Ecosystem.


There are very useful Open Source Libraries / Projects / Demos by Unity. As you might know Unity Game Engine is not open source. It can only be accessible for certain enterprise deals. But some important parts apart from game engine is open sourced in the account of Unity Technologies on bitbucket. It is always good to keep an eye on these projects to have better understanding of how Unity is working under the hood. And also it can give you some insights about the development style and practices of Unity Team.

Some of the very commonly used open sourced libraries by Unity:


Unity collects very useful statistics about the specs of mobile devices running Unity games. They share these stats on Unity Hardware Stats page. I strongly recommend to check this page frequently, it can show the characteristic of devices based on different dimensions and also platforms. The hardware data comes from users who installed some sort of Unity game, so it represents combined statistics of all Unity game players. Please be aware that, your particular game might be targeted at different type of users with different hardware.

The End


So I have posted eight blog posts including this one. I have written more or less everything that I have planned in the beginning. Thanks for reading.

Now I will make a presentation from these posts to present on voxxed days belgrade. I don't promise but most probably I will tell you about the event and also share my slides here.

19 Eylül 2016 Pazartesi

Continuous Integration and Delivery with Unity3D

This is the seventh post about Unity3D so far, if you wonder what I have said before, please take a look:

All jobs should be green 
We are already using Jenkins as our Continuous Integration (CI) platform. CI is a development practice that requires developers to integrate code into a shared repository several times a day. Each check-in is then verified by an automated build, allowing teams to detect problems early.

We are using Jenkins as CI platform at Peak Games including server side, CRM, mobile, web... So obviously we decided to use Jenkins for Unity projects also. We have seven Jenkins jobs for a single Unity game. Let me tell you about what these jobs are doing.


Common Gaming Libraries


Since we are planning to use Unity for at least 2-3 board/card games, we started creating common libraries that will be used by all Unity games. Before Unity, we have done similar work for iOS and Android native. That is why we have the knowledge to decide what functions would be common and re-usable across all games.

Right now we have 18 common libraries written in C# and 2 native plugins written in Java and Objective-C. To be able to integrate these libraries to actual game code we didn't use any dependency management framework, we just use two different custom approaches. When we are building these integrations we couldn't find a well known, mature enough dependency management framework that is why we created our own custom solutions.

For native plugins (Peak CRM API Client, Native IAP Client). We have created one project for each. Each of them has similar approach inside the project. Actually each project includes four separate projects inside. One for iOS in Objective-C, one for Android in Java, one for creating a dll in C#, one for reference sample Unity application. And of course one build script to build all native codes and create a dll file. Creating native plugins for iOS and Android is quite different, for more information please refer to these documentations (iOS and Android).

So we have two Jenkins jobs to create these plugins and generate available links to download. Once these plugins developed, they will not change a lot. So to integrate them, there is a manual operation. Actually just copy and paste after downloading from given URL.

For C# common libraries we have created one single Unity project called GamingLibrary. Unlike native plugins we don't want to create one or more dll files. Because these common libraries might change (with additions, changes, removals) a lot during the game development. We want to see the actual code of these libraries while we are developing.

So we tried to generate Unity Package from this project and import it into actual game project. It was working like a charm in Editor. You could import any package even your code has some compile issues. It would not compile because there were dependencies to our gaming lib package. But after the import it will compile and work successfully.

We were happy till to see that importing in batch mode (via command line) has a very subtle difference according to Editor. In batch mode, Unity needs to compile the project to be able to import any package before the import action. Which would not work for us because as I said our game code is not compiling before the gaming lib package import. We try to find a work around for this, but couldn't find.

Then we write a script file to copy gaming libraries into actual game code base. Basically we just use rsync to make synchronization.  So we have one Jenkins job to compile and run unit tests on each commit to gaming library.


Game Code Base


So the rest of four Jenkins jobs are there for each Unity game. I will use Gin Rummy Plus as an example.

First one is there for actual CI purposes, it is compiling and running unit tests for each commit to main branch. Before compiling, it is using the above script file to integrate gaming libraries into code base and then using Unity's batch mode mechanism to compile it. For Gin Rummy Plus it has been 2187 run so far and it takes 40 seconds one individual run.

Second one is for running integration tests, it is working twice a day and manually when required. I have already mentioned about integration tests in more detail. And for Gin Rummy Plus it has been 462 run so far and it takes 18 minutes one individual run.

Third and forth ones are there for creating binary files for iOS and Android. Actually each of them is creating two binaries one is to send HockeyApp for testing purposes, one is to send App Stores for publishing. The jobs are not just creating binaries but also sending them to HockeyApp and App Stores. These binaries have some differences, for instance the ones for HockeyApp includes some extra debug features like cheat buttons to be able to test some scenarios, or some extra information to be able to understand a/b test groups for instance.

We are running these jobs manually, when we think that a new version of the game needs to be published. After job uploads the binaries it is informing our product managers and testers automatically. After that it is up to them to publish the binary or open tickets about the issues they have discovered in this version.

To differentiate the builds inside the code base we are using Scripting Define Symbols. I mean custom compilation flags (see Unity's platform dependent compilation page for details). We have two extra flags (DEBUG and ADHOC) a long with build-in PRODUCTION flag. DEBUG is there for development purposes it has more logs, more extra functions. ADHOC is there for testing purposes, and PRODUCTION is for stores.

Let me give more details about these binary build jobs.


Binary Builds


For iOS, when you build a Unity project it creates an intermediate Xcode project, from that project you can create the actual binary ipa file (you have to run it on MacOS system). And this job is doing it twice in a single run, to create two binaries as I mentioned above. That is why iOS jobs is taking 17 minutes on average. 

After creation of intermediate Xcode project, most of the cases you have to make configuration on this intermediate project to be able configure some native iOS settings like compile flags, like info.plist updates, like url schemes updates. So we are using Unity's post process build attribute frequently to make this custom configuration programatically.

To create the binary from the Xcode project, and upload to HockeyApp and App Store (TestFlight) we are using our custom iOS Build Library which is already being used for our native iOS games. I will not give any details of native builds and all confusing provisioning profile configurations. That is another post's topic.

The last binary that we have sent to App Store is 56 MB. It is almost two times bigger than our native iOS games. It is mainly because of splash screen. Yes, you read it correctly, just because of splash screen your binary is increased at least 10 MB. I hope there will be a solution in the next versions of Unity.

For Android, it is much more easier process. Because Unity can create binary  apk file without creating an intermediate project. So it takes way too quick to create two binaries according to iOS build. It takes around 7 minutes to create two binaries and upload one to HockeyApp and other to Play Store. We are using Jenkins plugins to make these uploads.

Unlike iOS builds, to make the native configurations we don't need to use post process build attribute. We just use the Manifest files to make the configurations.

The last binary that we have sent Play Store is 36 MB. It is also higher than our native Android games, but not like iOS. It is just 5-6 MB bigger. I can give more information about how to decrease the size of binaries on iOS and Android in another post (may be).

So as a conclusion our CI system for Unity games is consist of Jenkins, Unity's command line tools and a little bit of shell scripting, that is all.

We are very close to end of this Unity3D series, just one more :) 

18 Eylül 2016 Pazar

Performance Optimization in Unity3D for Mobile Games

This is the sixth post on Unity3D so far, if you wonder what I have said before, please take a look:


Performance is important. Nobody argues with that, it is important on every software projects backend, web, mobile it doesn't matter. Whatever technology it is, whomever using it, everyone wants that product to be fast, smooth and responsive.

In casual games, may be  it is a little bit more important. Since it is casual game, it should open very quickly because you just want to play the game for 5 minutes, you should not wait for minutes to open. And more importantly it should work on any kind of device not just high end devices, because you don't expect anyone to have that device only for game purposes.

When you consider all of these, performance is not something you should leave behind. You have to consider it in the very beginning of the project and also keep in mind while you are developing any feature. 

With Unity it is harder I guess. Because it is a black box engine that support multiple devices from mobile ones to game consoles. It is easy to create a game project and develop a playable version. But it is really hard to polish it in means of performance. It has a lot of adjustment points, some of them makes console games much better, but makes mobile game suffer. So it is important to have good knowledge and experience on Unity to optimise your game. 

There is a talk in Unite 2016 Europe about Optimizing Mobile Applications, I strongly advice this talk. 

The main things you'll want to consider are the size of your game, how much memory your game uses, and how much computing power your game needs. When targeting mobile devices, remember that a large portion of the market has phones that are a few years old. To reach the widest possible audience, you should optimize your game for low-spec devices. Unity releases very useful statistics about the specs of mobile devices running Unity games. 

I will mention three practical points about what we have done in our card games to improve performance. 

Sprite Sheets


In computer graphics, a sprite is a two-dimensional bitmap that is integrated into a scene. To render / draw that sprite into scene, game engine has to issue a draw call to the GPU. All the purpose is reduce Draw Calls and increase Total Batched Calls. A draw call is one pass from a GPU. The goal is that we want to have everything batched because batching is what happens when we actually talk to the GPU, so the more draw calls we have batched into a single pass means that the performance will be better inside of the rendering of our game.

To see how these objects rendered into screen we are using Frame Debugger. And it shows that how sprites rendered in which order. When you look at the gif image in the left, you can see some sprites rendered only single call, some are rendered together with other sprites, which means they rendered in batch. No matter how many sprites exists while they are in batch it is count one draw call means one call to GPU. To be able to batch all sprites we are using sprite sheets to load every sprite into one big atlas file and load to GPU and increase the Bathced Calls and reduce the Draw Calls. 

A sprite sheet (atlas file) is a bitmap image file that contains several smaller graphics in a tiled grid arrangement. By compiling several graphics into a single file, you enable Animate and other applications to use the graphics while only needing to load a single file. Unity has built-in Sprite Packer to create sprite sheets from your sprites. We are using TexturePacker which is a better packer according to Unity's built-in one.

One other key point is the scene hierarchy. Unfortunately it is also impacting the draw calls count especially if you have multiple sprite sheets. Let's say you have two sprite sheets and you need to render some sprites from one, and some from other in the same scene. Try to organize your hierarchy to gather all your sprites that comes from same sprite sheet, so that they will be rendered in batch with one draw call. And then put others that comes from second sprite sheet.

Unity Profiler


In the editor there are two types of profile tools. 

One is called Stats Window. While your game is running, click on the Stats button at the top right of the game window to open the Stats window. Here you can see some basic stats about your game. At the top is your frames per second, which is not that useful since it will be different when running on a mobile device. But things like the number of draw calls, triangles, and textures should be consistent with what you'll get on mobile. The more draw calls and triangles you have, the more processing power your game will require to render your scene. There's no hard and fast rule as to many draw calls you should have, since it depends a lot on what shaders you use. Under 50 draw calls should run quickly on most devices although newer devices and tablets can handle more. If your game is running slowly, and you see that you have hundreds or thousands draw calls, that's probably one of the reasons.

The number of textures being used is another good metric to consider. If you're loading and unloading textures at run time, like we did when switching atlases, the number of textures in the stat window will let you check if they are being de-allocated properly or if they're still in memory. You can also see how much memory is being used by textures at any given time.

Staying under 30% of the available memory on the device is a good idea. But remember that there are other things in the scene that also use memory, besides the textures. Even without the pro version of Unity, you can get some useful information about the performance and memory usage of your game using the Stats window.

Second one is Profiler Window. The Unity Profiler Window helps you to optimize your game. It reports for you how much time is spent in the various areas of your game. For example, it can report the percentage of time spent rendering, animating or in your game logic. You can play your game in the Editor with Profiling on, and it will record performance data. The Profiler window then displays the data in a timeline, so you can see the frames or areas that spike (take more time) than others. By clicking anywhere in the timeline, the bottom section of the Profiler window will display detailed information for the selected frame. Let me tell you what you can measure with profiler. Before moving that part, you already might know that profilers also add some overhead on the performance. So when using profiling it is typical to consider only the ratio (or percentage) of time spent in certain areas. 

The CPU Usage Profiler displays where time is spent in your game. When it is selected, the lower pane displays hierarchical time data for the selected frame. See documentation on the Profiler Window to learn more about the information on the Profiler timeline.

The Rendering Profiler displays rendering statistics. The timeline displays the number of Batches, SetPass Calls, Triangles and Vertices rendered. The lower pane displays more rendering statistics, which closely match the ones shown in the Stats Window.

The Memory Profiler shows a simple overview how memory is used throughout Unity in real-time on a per-frame basis. And also allows you take a snapshot of the current state. After taking a sample, the Profiler window is updated with a tree view where you can explore memory usage.

The Audio Profiler monitors significant performance meters about the audio system, such as total load and voice counts. When you highlight the pane, the lower part of the window changes into a detailed view about various parts of the audio system not covered by the graphs.

The Physics Profiler shows the following statistics like the numbers of Active and Sleeping Rigidbodies, Static and Dynamic Colliders.

The GPU Profiler is similar to the CPU Profiler, with various contributions to rendering time shown as a hierarchy in the lower panel. Select an item from the hierarchy to see a break-down of contributions in the right-hand panel.

For more information about Unity Profiler please refer to official Unity documentation.

One last thing is there is a new very low level memory profiler API. It can tell you which objects got blamed for how much c++ memory allocations. It will also give you a dump of the entire c# heap, as well as c# type descriptions. This API is too low level for most people to benefit from. The intention is to write a much nicer UI window on the top of this API that will actually be readily useful for many users, in helping them figure out which objects are loaded, which objects take a lot of memory, and most important, why that object is in memory. This repository is that nicer UI window, very much in progress of being built. Actually it is an open source project by Unity.

Xcode Instruments


There is an official Unity post about how to use Xcode as profiler. Officially Unity team also suggesting to use Xcode Instruments. Even if you don't have any performance problem, still it would give you a lot of details about how Unity is working under the hood. Because profiler will not just profile and show your code, but also internal codes of Unity.

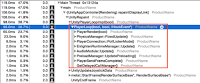
Xcode Instruments can see the things that Unity Profiler can't see such as application startup time. In the Time Profiler you can see what makes your app waits while showing splash screen. Most of the time spent in the internal Unity codes, but there are two points that your code impacts this time. 

If you look at the image you will see PlayerLoadGlobalManagers which is responsible to index your Resources. So if you have too many items in this folder it will directly impact your apps startup time. In the beginning we were putting all our resources into this folder even it is not needed to load it dynamically. After learning this fact, we just leave only the dynamic images in the folder and gain around 5.4% startup time decrease. 

Second item is the Awake functions of game object attached in the first scene (consider that we have only one scene). All Awake functions will be called during the splash screen. We have calculated that 19.2% of startup time is because of these functions. When we investigate deeply we understand that almost all of this time is being spent while calculated dependency graph by StrangeIoC. We didn't do anything to reduce this time yet.

On the other hand while running game, you can profile the update loop of UnityEngine. And you can see the internal code on each frame as well as your code executed on Update, FixedUpdate and LateUpdate functions. And again your code executed on DelayedCallManager which is there for your Coroutines. And you may also see some extra time on CanvasManager which is responsible for all Unity's UI system like calculations of text sizes and rendering of texts etc..

Another very handy instruments of Xcode is Memory Leaks, Xcode will show you the memory leaks of your code (sometimes it is internal code), but sometimes it gives you a good idea to handle or get rid of this leak. 

Actually other than memory leaks, you might still have memory issues. Especially the most common one is Memory Fragmentation. Unity has automatic memory management which is cool. But if your game creates a lot of temporary object while executing your code, this automatic memory allocations by Unity will end up memory fragmentation. Don't forget in Unity, the heap only expands, never shrinks. So it is very very important to avoid temporary objects. To avoid them you have to know when they are created by Unity. Here it is the most commonly used ones:
  • Use simple for loops instead of foreach loops. The reason is that a foreach loop internally creates a new enumerator instance.
  • Boxing is the process of converting a value type to the type object or to any interface type implemented by this value type.
  • String Concatenation also creates temporary string objects, instead String Builder can be used. 
  • All Unity APIs that return arrays (CreateScriptingArray) will allocate new copies of arrays. Minimize calls to these methods.
  • Linq usage will create extreme amount of temporary objects so examine the time lost to creating and discarding Linq queries; consider replacing hotspots with manually optimized methods.
So I think this is all I want to mention about optimizing the mobile Unity game. Actually I was planning write a few lines about optimizing the size of the binaries (on iOS and Android) but I guess it is part of another topic let's see.

I am almost done with this Unity related blog posts. A few of them left. Just hang in there :)

16 Eylül 2016 Cuma

Debugging in Unity3D

Now it is time to Debug

It has been four posts so far.


1. Why do we move to Unity3D?
2. Power of Unity3D Editor
3. Coding in Unity3D
4. Testing in Unity3D


Another important topic is debugging, which is an essential point in software engineering. As a developer we read codes, even more than we write code. While reading the code, having good debugging skills and tools is quite important. It makes your life much easier. With Unity you have different kinds of debugging tools as well as very basic debugging approaches.

MonoDevelop


I have already write about Mono Develop, the default IDE of Unity. It has built-in debugger, which is integrated with Unity. So you can attach to Unity process inside the IDE, and put a breakpoint in the code base and run the editor. You will see that it will stop on the selected line, and you will have the usual actions like pause, continue, run step by step, step inside etc... And also you can see the usual information like stack trace, value of local and global variables etc...

It sounds like a proper debugger, right? 

Yes in theory, it is a proper debugger which has almost every expected feature from a regular debugger. 

But unfortunately in practice it is not like that. It is almost certain that it will crash either Unity or MonoDevelop in each one of two debug try. So it is literally useless, unless you want to live some kind of excitement and believe me it is not that pleasant to restart Unity (or MonoDevelop) in the middle of coding. 

So the old way is the best way. Plain old regular logging. That is it. Put Debug.Log() in every corner of the code base and learn how it is running. And find what you are looking for. Yes it is not that fancy but it is some how enough, and it is the only way of debugging your scripts. So I suggest you to get used to it.


Editor Debugging


In one of previous posts, I have mentioned about Unity Editor. Here it is another very handy feature. Unity will actually let you change the value of a script’s variables on inspector window while the game is running. This is very useful for seeing the effects of changes directly without having to stop and restart. When gameplay ends, the values of the variables will be reset to whatever they were before you pressed Play. This ensures that you are free to tweak your object’s settings without fear of doing any permanent damage.

When you pause the game you can see all your game objects' properties and states. It is a kind of debugger right, even it has step by step option :) actually it is a little different of course. Each step is not a new line in your code, each step is the next frame. That is why it is called "frame by frame" :)

You can see the scene and also all the state of the scene when you pause the game or when you go frame by frame. Actually there is even better option that you can change everything in the scene. Enable / Disable game objects, change their location or scale or color. What ever you change, you will see the change instantly. Then when you hit play again it will resume with this new states. Actually you can do this without pausing the game at all.

This is very powerful feature that you can leverage to debug the scene and game objects, and also you can use this feature to tweak some fine adjustment on the scene like 1 pixel left, 1 pixel right :)

To make it clear, let me give you an example from our games. As you already know we have a card game Gin Rummy Plus. According to rules of this card game you can finish the round when all your cards sorted for certain rules. And to finish the round you have to throw one last card to pile. And it should not be same as throwing a regular card, it should be more impressive and it should give the feeling that you won the round.

To be able to give that feeling we should have try different options. We have created three different bezier path. One for player's last card throw, one for opponent's last card throw and one for regular card throw. And instead of hard coding these bezier paths, we just use editor window to tweak and find the best way of these throw paths.

And one more tip is you can also pause the game programatically. Just type Debug.Break() in your code and stop the world according to a condition. And you don't need to worry about it later, because it will do nothing in production. It has one more significant advantage over manual pausing and stepping forward. It can pause your game in the middle of an execution frame. This means that part of your object may be still waiting for the Update() call and the other part has already been updated. This is really useful for situations when you’re dealing with a bug that appears randomly.

Frame Debugger


The Frame Debugger lets you freeze playback for a running game on a particular frame and view the individual draw calls that are used to render that frame. As well as listing the drawcalls, the debugger also lets you step through them one-by-one so you can see in great detail how the Scene is constructed from its graphical elements.

The Frame Debugger window shows the drawcall information and lets you control the “playback” of the frame under construction. The main list shows the sequence of drawcalls in the form of a hierarchy that identifies where they originated from. The panel to the right of the list gives further information about the drawcall such as the geometry details and the shader used for rendering.

Clicking on an item from the list will show the Scene (in the Game view) as it appears up to and including that drawcall. The left and right arrow buttons in the toolbar move forward and backward in the list by a single step and you can also use the arrow keys to the same effect. Additionally, the slider at the top of the window lets you “scrub” rapidly through the drawcalls to locate an item of interest quickly. Where a drawcall corresponds to the geometry of a GameObject, that object will be highlighted in the main Hierarchy panel to assist identification.

To reduce the drawcalls, frame debugger is the key tool that we are using in our games. As you can see in the screenshots above, we still have some work to do. Our game's lobby screen has 55 drawcalls which is not a problem mid and high end devices, but might be a problem for some low end devices. That is why our target is to reduce it to at least less then 50 drawcalls.


Debug on Device


In general you will not need to make a lot of debugging on devices. According to our experience with Unity, most of the time you will see actual device behaviour inside the editor. And most of the time it is not changing according to device type. But for some rare cases and also for some native calls you might need to debug on device.

Debugging on device is more difficult and primitive. In theory you can have breakpoints in the code especially on iOS environment, but you cannot see the actual code, because it will be converted to native binary files. That means it is not useful at all. So only option is to put logs in your code and tail this logs to see how your code is behaving. Adding logs is not different than the one that I have already mentioned. But to see that log while running on device is a little different.

To see the logs while playing game on device you are going to have different ways on iOS and Android.

First iOS. Before everything make sure that you are on a MacOS system, and Xcode has been successfully installed.

The iOS application build process is a two step process. When you build the Unity iOS game an Xcode project is generated. It is generated with all the required libraries, precompiled .NET code and serialized assets. This project is required to sign, compile and prepare your game for distribution and/or run on the actual device.

When you first run the game on device via Xcode project you are going to notice that it will take minutes to start running. After that you will see the logs in the console view of Xcode. Unfortunately it takes ages to see the logs on device.

One tip, if you want to see the logs on an iOS device without running the application via Xcode. Choose Window -> Devices from the Xcode menu. Then choose the device in the left column. Click the up-triangle at the bottom left of the right hand panel to show the device console.

Another tip, use incremental build when you build iOS app from Unity to quicken to run on Xcode. The C++ code generated by the IL2CPP scripting backend can be updated incrementally, allowing incremental C++ build systems to compile only the changes source files. This can significantly lower iteration times with the IL2CPP scripting backend. To use incremental builds, choose the “Append” option after selecting “Build” from the “Build Settings” dialog. The “Replace” option will perform a clean build.

Second Android. Before everything make sure that Android SDK has been successfully installed. And integrated with Unity.

You can build an Android application and install it to device is just one step. And it is much more faster according to iOS build. After installing and running the app on device you just need to open command line tool and type "adb logcat -s Unity" you will see all the logs related with Unity and your game.


Thanks for reading :) please go on with this post if you wonder how to make performance optimization in Unity3d for mobile games.